

Industrial Intelligence Systems
Improve profitability through real-time operational intelligence.
We help manufacturers reduce costs, optimize production and operations, and improve profitability by transforming production, energy, and business data into real-time operational intelligence.
Powered by the InAnalytics Data Platform.
Open architecture for Industrial Intelligence, data integration, analytics and automation.

🏅 Recognized at Industry Week 2025
— Quality & Innovation Award
Real-Time Operational Balance Sheet
The missing layer between production and finance.
See your plant's operating result in real time.
Know where you are. Know where you'll finish.
Most manufacturers learn their financial result after the month has closed.
We show your operational result online — continuously updated with actual production data, historical performance, forecasts and simulations.
See not only what your plant has achieved, but also what it is expected to deliver by month-end and year-end.
One enterprise. One operational picture. One plan.

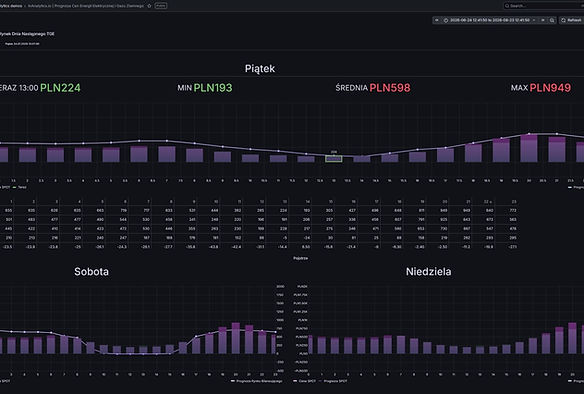
Energy Market Intelligence
See today's prices. Understand tomorrow's market.
Monitor live electricity and natural gas prices, explore forecasts and market trends, and see how energy markets evolve day by day.
Our Industrial Intelligence Algorithms continuously analyse historical data and generate forecasts that help manufacturers better understand market dynamics and support energy-aware operational decisions.
Track the market live. Explore the dashboard.
Why manufacturers choose Industrial Intelligence
Industrial Intelligence Assessment for Your Plant
- Spend one day with us.
We'll visit your facility and identify:
✓ What is really driving operating results
✓ Where your biggest cost and energy losses occur
✓ Which processes are limiting throughput and profitability
✓ How to measure and forecast operating performance with an Operational Balance Sheet

The technology behind Industrial Intelligence System
InAnalytics Data Platform connects industrial data, business and external data to modern analytics and open BI - in real time.

Proven in Manufacturing
Heat and Gas Analytics for Boilers in Aluminum Systems Production
Industry: Aluminum Systems Manufacturing
Results:
-
Improved efficiency
-
Reduced energy waste
-
Enhanced process control


Compressed air is one of the most expensive utilities in manufacturing.
And one of the least optimized.
We combine:
-
Compressor operation data (e.g., Atlas Copco Optimizer)
-
Energy consumption
-
Production output (m³ of air)
-
System pressure behavior
This allows us to move from monitoring → understanding → optimization.
From our compressors dashboard (Grafana powered by our platform), we can:
✔ Measure efficiency (kWh/m³) of each compressor
✔ Analyze performance of the entire compressor fleet
✔ Detect anomalies and unstable operation
✔ Estimate air leaks — without additional sensors

Connect Any Industrial Data Source.
From PLCs and SCADA systems to ERP, laboratory systems, energy meters, market data and cloud services — InAnalytics Data Platform connects everything into one unified operational data model.
InStudio — a development environment for building and managing your data logic in one place.
Create, test, and deploy data applications with full control over data, devices, and automation.

An open ecosystem, built on proven technologies.
-
Open architecture (no vendor lock-in)
-
Full control over data and algorithms
-
Scalable from pilot to enterprise
Works with open BI tools and databases:
-
Grafana
-
Power BI
-
Metabase
-
Looker
-
PostgreSQL / MySQL


